Forex & Trading
Currency pairs, central banks, and macro flows.
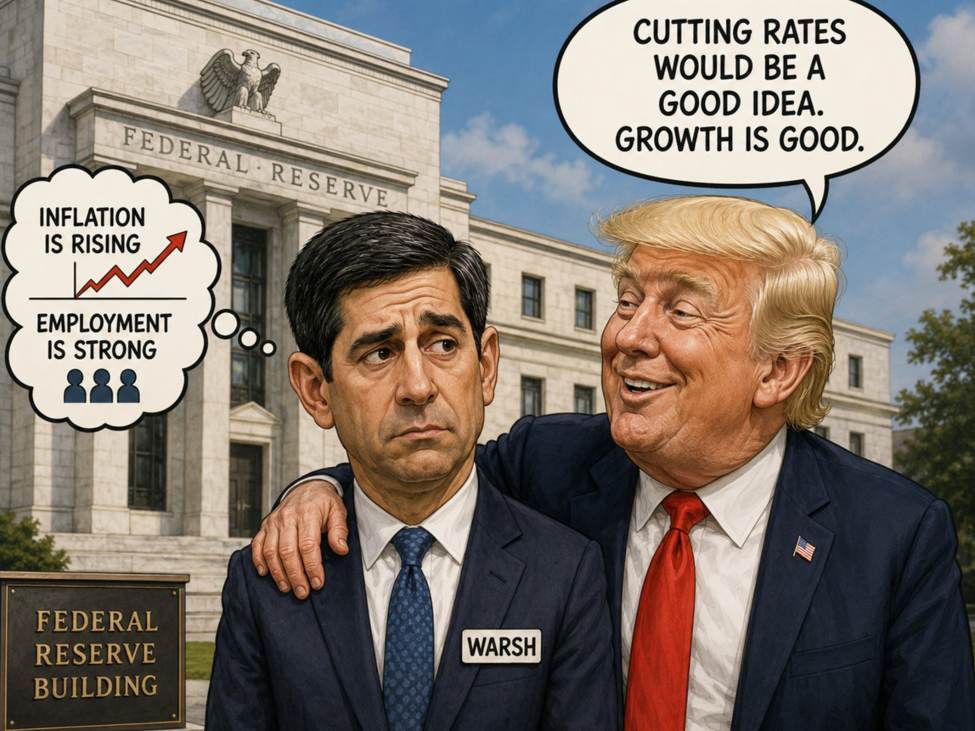
Trump: Would like to see lower interest rates
Will leave interest rate decision to Warsh Would like to see lower interest rates Says the country is doing well, market should go up He would not mind if Warsh were to cut interest rates. Will leave rate cut to Warsh during October meeting. What is curious is his response that will leave rate cut to Warsh but cites the October meeting. He seems to be giving in for the June, July, September meetings. On Iran and oil prices says: Having great success with Iran, and Iran is in no position to have a nuclear weapon. Has about energy prices, says that they have many options More: Meeting scheduled with AI companies Concept of American public AI partnership it is interesting This article was written by Greg Michalowski at investinglive.com.
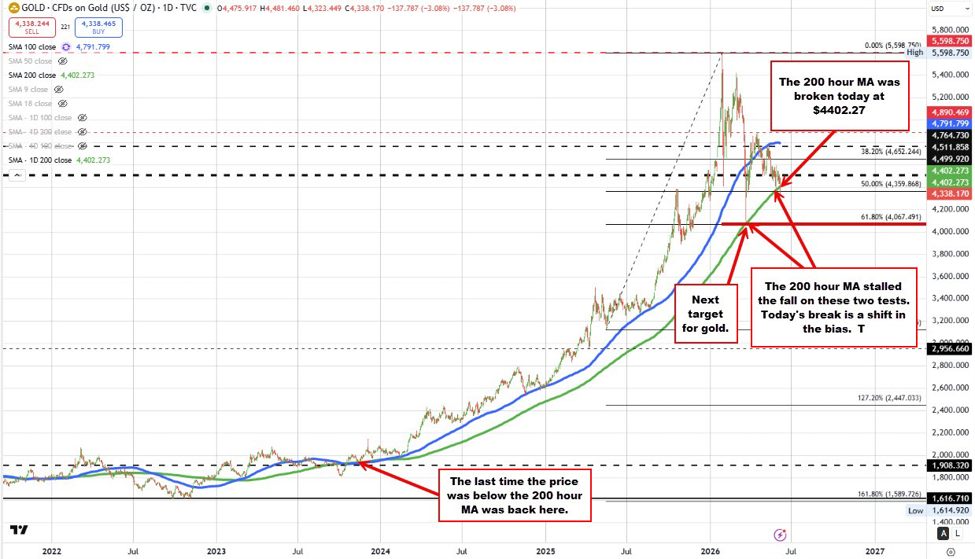
Gold is sinking with the US dollar rising and yields moving higher
With both the 200-hour moving average and the 50% retracement level now broken, sellers have seized near-term control. It would take a move back above those levels to ease the downside pressure and improve the technical outlook. Silver is also sharply lower by 6.54% with a decline of -$4.81 but remains above its 200 hour MA at $66.852. This article was written by Greg Michalowski at investinglive.com.
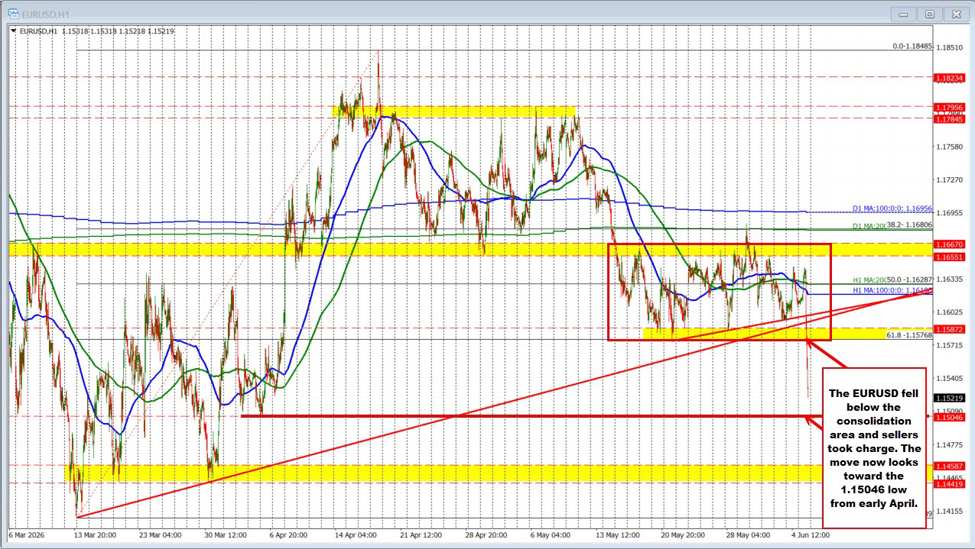
EURUSD continues the tumble lower
Fundamentally, the move is being fueled by a sharp rise in U.S. Treasury yields following the stronger-than-expected U.S. jobs report. The 10-year yield is up 6.3 basis points, while the 2-year yield has surged 11.7 basis points, helping to underpin the U.S. dollar. The employment data has also added a new layer of intrigue ahead of Fed Chair Kevin Warsh's first FOMC meeting on June 16-17. Recall that three policymakers dissented at the last meeting, favoring the removal of the easing bias. With labor market strength persisting and higher oil prices beginning to influence inflation expectations, the debate may increasingly shift toward whether policy should move to neutral—or even hint at a more hawkish stance—rather than maintain an easing bias. This article was written by Greg Michalowski at investinglive.com.
CNN: Iran-US talks reportedly deadlocked
CNN is reporting: Iran says negotiations with the U.S. have stalled, with senior adviser Mohsen Rezaei claiming President Trump must act to break the impasse. Iran is demanding the release of $24 billion in frozen assets as part of any agreement: $12 billion upon signing an interim deal. Another $12 billion at a later stage. Iran views the asset release as a trust-building test, arguing that unlocking the funds would demonstrate U.S. commitment to a lasting agreement. U.S. officials reportedly oppose releasing the funds at this stage, concerned that doing so would reduce a key source of leverage over Iran. Rezaei warned against a return to military conflict, stating that if fighting resumes, Iran could expand operations beyond the Persian Gulf. Potential areas of escalation mentioned by Iran include: Strait of Hormuz Indian Ocean Bab al-Mandab Strait Red Sea Mediterranean Sea Iran threatened broader attacks on U.S. military assets if another conflict breaks out. Rezaei ruled out a meeting between President Trump and Supreme Leader Ayatollah Khamenei, saying the negotiations are currently in an early stage and have reached a standstill. Market Implications The comments suggest peace negotiations remain fragile, reducing the likelihood of a near-term breakthrough. Any signs of renewed tensions could support higher oil prices due to concerns over disruptions to shipping routes and energy supplies in the Middle East. Traders will likely watch for any U.S. response regarding the frozen assets issue, which now appears to be a central sticking point in the negotiations The current price of crude oil is trading at $90.75. That is down $-2.32 on the day. This article was written by Greg Michalowski at investinglive.com.

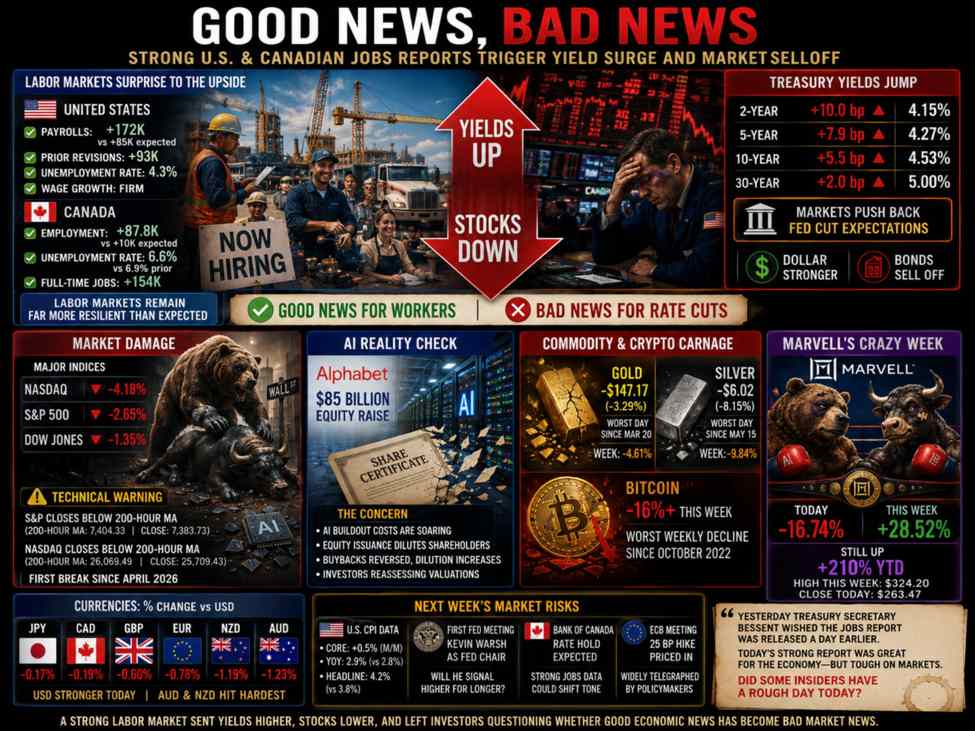
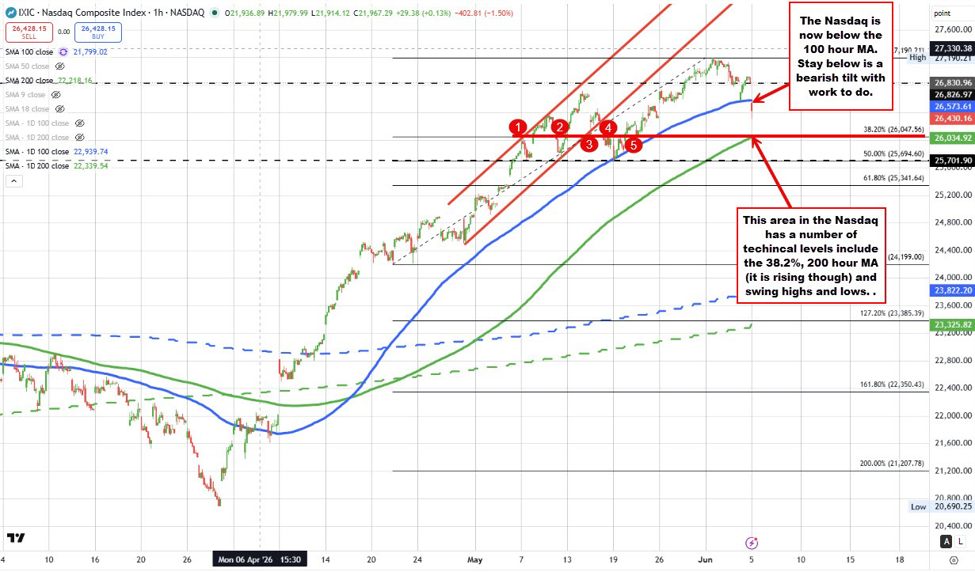
Trump hheers Jobs report. Bond yields rising/ stock sliding send warnings
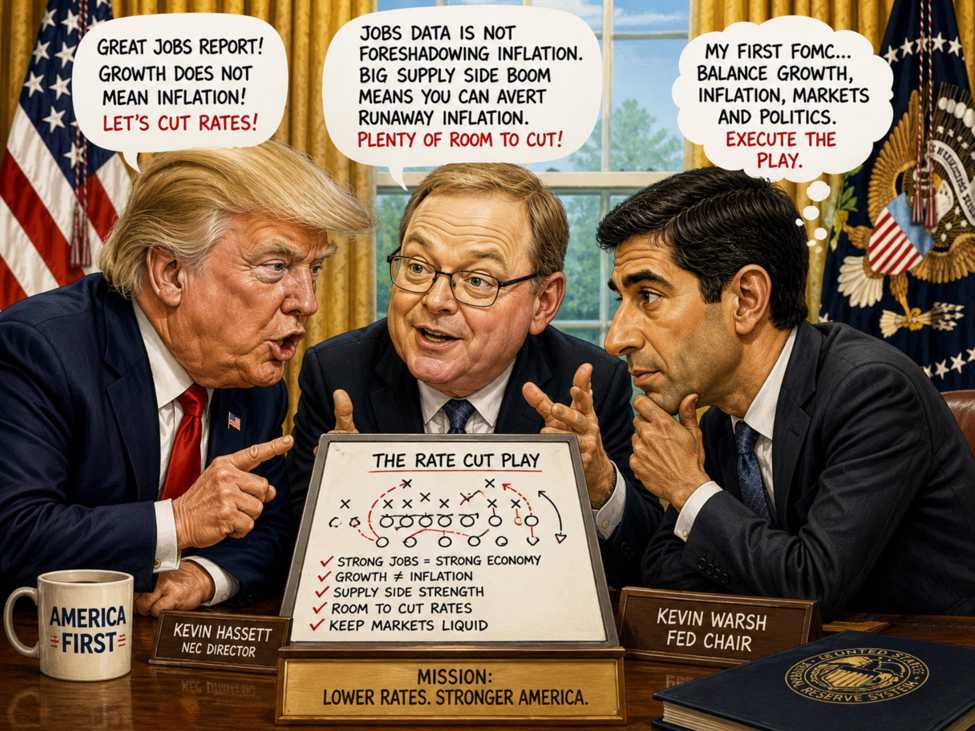
The stronger-than-expected U.S. jobs report has created an interesting tug-of-war between the White House, the market, and the Federal Reserve. President Trump wasted little time weighing in, arguing on Truth Social that a "great Jobs Report" should be bullish for stocks, not bearish, emphasizing that economic growth does not automatically translate into inflation. White House NEC Director Kevin Hassett echoed that sentiment, saying the jobs data is not foreshadowing higher inflation and that oil market disruptions are unlikely to materially impact core inflation. Hassett also argued that strong supply-side growth can help prevent runaway price pressures and suggested the Fed has room to be patient, even going so far as to say policymakers have been behind the curve and have had ample room to cut rates. The market, however, viewed the data differently. Treasury yields surged following the report, with traders focusing on the risk that a resilient labor market and sticky inflation could keep rates elevated for longer. The two year yield up 10 basis points at 4.151%, and the 10 year up six basis points at 4.537%.fff That repricing weighed on equities, with the brunt of the impact being felt by the NASDAQ index which is down 2% currently at 26294.95. Its price is now running away from its 100 hour moving average at 26569. The price is currently at 26292. The S&P is testing its 100 hour MA at 7502.51. A move below with momentum would be more bearish. That leaves newly appointed Fed Chair Kevin Warsh facing an early test. On one side are White House officials arguing that growth is not inflationary and that the Fed should have flexibility to ease policy. On the other side are bond traders who responded to the employment data by pushing yields sharply higher, signaling concerns that inflation pressures may not fade as quickly as hoped. Complicating matters further, the Fed enters its blackout period at the close today ahead of the upcoming FOMC meeting, meaning policymakers will not be able to publicly shape expectations. As a result, markets will be left to interpret the incoming data on their own. Notably, investors have heard very little from Warsh since he became Fed Chair, leaving uncertainty about how he will balance the competing forces of solid growth, stubborn inflation, rising yields, and mounting political pressure. The next FOMC decision may provide the first real insight into the policy framework of the new Fed Chair. PSS. Although Warsh wants to please the President for giving him the dream position of Fed Chair, he is also pragmatic enough to not mess around with the rate anytime soon. However, what he eventually has to say, will be dissected as to how dovish or hawkish he is. The Punt is to agree with the other Fed officials and just take the leadership role The game plan might be to eventually cut, but it might take a defense alighment that shows oil down sharply, inflation falling, inflation expectations weakening. Whether they ignore the job market because of the shift from demographics, immigration policy, greater productivity influencing - and that it is more about inflation and not about managing a slow down in the economy. This article was written by Greg Michalowski at investinglive.com.
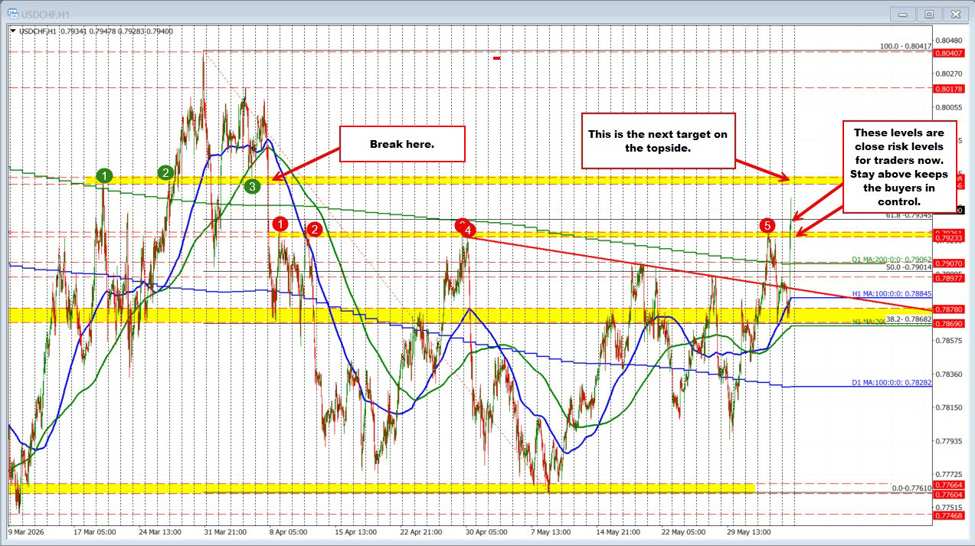
USDCHF breaking higher the price is breaking away from recent swing highs
The USDCHF is breaking higher and gaining upside momentum as it pushes above a key resistance zone defined by the late-April and late-May swing highs between 0.7923 and 0.7926. The pair has also moved above the 61.8% retracement of the decline from the March 31 high to the May 8 low, which comes in at 0.79345. That combination of technical breaks gives buyers greater control in the near term. With the breakout now underway, the former resistance area between 0.7923 and 0.7935 becomes an important support zone. As long as the price remains above that area, buyers maintain the advantage and can continue to target higher levels. On the topside, the next key objective comes in between 0.7956 and 0.7961, an area that served as an important swing zone during March and April. A sustained move above that level would open the door for a run toward the 0.8000 psychological level, which is likely to attract increased attention from traders. Just above that sits another notable swing target near 0.8018, followed by the 2026 high at 0.80417. Looking at the broader chart, the sharp decline seen on April 7 and 8 left relatively little resistance overhead, giving the pair room to extend higher if bullish momentum remains intact. For now, the technical bias remains tilted to the upside, with buyers focused on holding above the breakout area and pressing toward the next resistance targets. Fundamentally, the move higher in USDCHF is being supported by a stronger U.S. dollar following the better-than-expected U.S. employment report. The jobs data pushed Treasury yields sharply higher, with the 2-year yield rising 10.8 basis points to 4.157% and the 10-year yield climbing 7 basis points to 4.547%. Higher yields are helping to boost demand for the dollar, adding a supportive fundamental backdrop to the pair's bullish technical breakout. This article was written by Greg Michalowski at investinglive.com.
Broader stock indices diverge: NASDAQ slides below moving average while S&P tries to hold
I want That divergence creates a dilemma for equity traders. The fundamental backdrop of stronger growth and higher yields is weighing on stocks, but key technical support levels have not yet broken across the board. As a result, traders will continue to focus on the major moving averages as both risk-defining and bias-defining levels in the major indices. Whether those supports hold or give way should provide important clues for the direction of the market into the close and in the trading days ahead.. The video above outlines the traders dilemma and also the key levels in play for both the S&P and NASDAQ indices. This article was written by Greg Michalowski at investinglive.com.
USDJPY volatile above the 160.00. EURUSD tests floor area. GBPUSD new lows for week
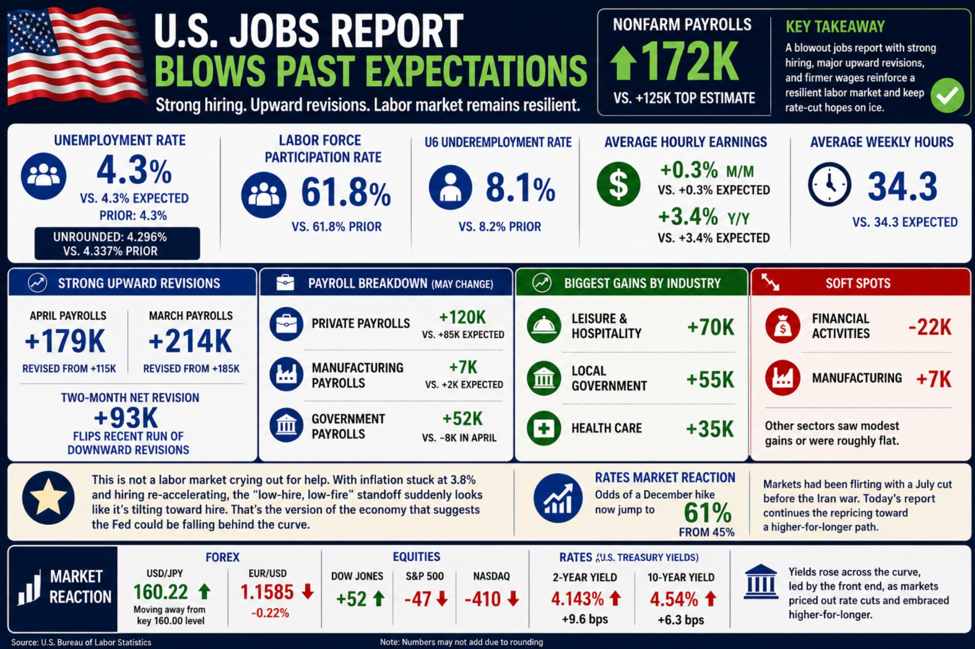
The USD is sharply higher following a much stronger-than-expected U.S. employment report. Nonfarm payrolls increased by 172K, well above the 85K forecast, while sizeable upward revisions added another 93K jobs to the prior two months. The unemployment rate held steady at 4.3%, average hourly earnings rose 0.3% on the month and 3.4% year-over-year, and the participation rate remained unchanged. Taken together, the report points to a labor market that remains resilient and is not showing signs of meaningful deterioration. The USDJPY initially surged to its highest level since May 1, reaching 160.22, but remains below the next key upside target at 160.446, the March 30 swing high. Above that level, traders would look toward the 2026 high of 160.717 from April 30. However, gains above 160.00 continue to attract caution as traders remain sensitive to the risk of official intervention, even in the absence of any direct warnings from Japanese authorities. After probing higher, the pair briefly pulled back before finding buyers once again. The 160.00 level remains a critical barometer for the pair. Staying above that threshold keeps buyers firmly in control. On the downside, the 100-hour moving average at 159.856 and the 200-hour moving average at 159.601 serve as important support levels. A move below those averages would weaken the bullish bias and shift the technical outlook more to the downside. Until then, the path of least resistance remains higher, with buyers maintaining the upper hand. The EURUSD has moved lower and is now testing an important support zone between 1.1576 and 1.1587. The low price has reached 1.1584 so far, putting the pair near the lower end of that key swing area. A break below the floor at 1.1576, and more importantly, the ability to stay below that level, would likely increase bearish momentum and open the door for a deeper move to the downside. From a technical perspective, the pair has already fallen below the trendlines highlighted on the hourly chart and is moving further away from its 100-hour moving average at 1.16225 and 200-hour moving average at 1.16287. Those moving averages now act as resistance and reinforce the bearish bias. While sellers remain in control, the next key test is whether they can force and sustain a break below 1.1576. Accomplishing that would strengthen the downside case and give sellers greater control of the short-term trend. This article was written by Greg Michalowski at investinglive.com.
Canada employment change 87.8 K vs 10.0 estimate. The unemployment rate falls to 6.6%
The employment change -17.7 K revised to xxK Employment change change 87.8K vs 10.0K estimate Unemployment rate 6.6% versus 6.9% estimate. Prior month 6.9%. Full-time employment change 154.0K versus -46.7L;ast month. Part-time employment change -66.2Kvs. 29.0 K last month average hourly wages or permanent employees 3.2% vs 4.8% last month Employment rose among employees in both the private sector (+56,000; +0.4%) and the public sector (+20,000; +0.4%) in May. The number of self-employed workers was little changed. On the surface a very strong number. The US had a stronger than expected jobs report as well. The USDCAD is trading at 1.3876 down from 1.3890 prior to the report. Details from Statistics Canada Employment increased by 88,000 (+0.4%) in May, the first significant employment gain since November 2025. The increase in May follows a net decline of 112,000 (-0.5%) over the first four months of 2026. On a year-over-year basis, employment was up by 147,000 (+0.7%) in May. The number of people working full-time rose by 154,000 (+0.9%) in May. The increase in the month offsets a downward trend observed from January to April, in which the number of full-time workers fell by 156,000 (-0.9%). In May, part-time employment decreased by 66,000 (-1.7%). The unemployment rate ticked down to 6.6%. The unemployment rate was at 6.5% in January so the price is moving back down toward that level Where were the jobs created: Looking at the components of the job creation, construction was the strongest while wholesale and retail trade was the weakest. 11 component industries saw advances in jobs while five saw declines: Construction: Employment increased by 27,000 (+1.7%), the largest gain among major industries. Despite the monthly increase, employment was little changed from a year ago. Information, Culture and Recreation: Employment rose by 19,000 (+2.3%), one of the strongest percentage gains in May. Employment was little changed compared with May 2025. Transportation and Warehousing: Employment increased by 19,000 (+1.7%). Compared with a year ago, employment was up 36,000 (+3.4%), making it one of the stronger-performing sectors over the past 12 months. Accommodation and Food Services: Employment climbed by 17,000 (+1.5%). Employment was up 34,000 (+3.0%) from a year earlier, reflecting continued strength in consumer-facing services. Manufacturing: Employment increased by 15,000 (+0.8%). Employment was little changed from a year ago but remained 44,000 (-2.3%) below January 2025 levels. The sector continues to face uncertainty related to U.S. tariff policies and broader economic concerns. Wholesale and Retail Trade: Employment fell by 35,000 (-1.2%), the largest decline among major industries. Employment has been trending lower since October 2025 and was down 64,000 (-2.1%) compared with a year ago. Key Takeaway Employment gains were broad-based across several industries, led by construction, transportation and warehousing, accommodation and food services, information, culture and recreation, and manufacturing. The primary area of weakness remained wholesale and retail trade, which continued its downward trend. Overall, the report points to a labor market that is finding support in service-oriented and transportation-related sectors, while retail employment remains under pressure. The USDCAD was trading near 1.3890 ahead of the report. It is trading modestly lower to 1.3875 off of the initial move. Overview of the Labour Survey: For background, the Labour Force Survey, published monthly by Statistics Canada, provides comprehensive data on employment, unemployment, and labour force participation across Canada. Released on the first or second Friday of each month at 8:30 a.m. ET, the report surveys approximately 56,000 households and tracks employment changes by industry, province, full-time versus part-time status, and demographic characteristics. The survey measures not only net job creation but also unemployment rates, wage growth, and labour force participation, offering insights into the health of Canada's economy. The data is closely monitored by the Bank of Canada when setting monetary policy and by economists assessing economic conditions. At the moment, there are no further cuts priced in for the Bank of Canada. Below is a summary of the recent Bank of Canada expectations: This article was written by Greg Michalowski at investinglive.com.

The USD is lower ahead of the US jobs report. What are the technicals telling traders
IN the video above, I take a look at a technical driving the EURUSD, USDJPY and GBPUSD. After the USD rose North American session erasing earlier declines and closing little changed, the Iraqis lower today with a decline of -0.37% versus the GBP and -0.28% versus the EUR. Versus the JPY, the greenback is lower by -0.12%. The US dollar is lower versus the Canadian dollar by -0.19%.I also take a look at its technicals ahead of the dual job report releases at the bottom of the hour. Yields in the US are modestly lower (less than 1%). US stocks in premarket trading are mixed with the Dow higher and the Nasdaq under pressure. The futures are implying: Dow +100 points S&P index -29.06 point NASDAQ index -296 points Crude oil prices are modestly lower down $0.14 on the day at $92.88. Gold is down by $6.80 or -0.14% and silver is down by $-1.08 or -1.3%. The price of bitcoin is lower reaching a new cycle low of $61,073. The next target would be the low price from February 6 that $59,930. The current price is trading off the lows at $61,928. At 8:30 AM ET, both the United States and Canada will release their May employment reports, making it one of the most important economic events of the week for North American markets. Traders will be closely watching the U.S. Non-Farm Payrolls report for clues on the pace of hiring, wage growth, and labor market strength, while Canada's employment data will provide insight into whether the labor market is stabilizing after last month's job losses. The results are likely to influence expectations for future Federal Reserve and Bank of Canada policy decisions and could trigger volatility in currencies, bonds, and equity markets. United States (May Employment Report Expectations) Non-Farm Payrolls (NFP): +85K vs. +115K prior Private Payrolls: +85K vs. +123K prior Manufacturing Payrolls: +2K vs. -2K prior Unemployment Rate: 4.3% vs. 4.3% prior Average Hourly Earnings (MoM): +0.3% vs. +0.2% prior Average Hourly Earnings (YoY): +3.4% vs. +3.6% prior Average Workweek: 34.3 hours vs. 34.3 prior Labor Force Participation Rate: 61.8% U6 Underemployment Rate: 8.2% Canada (May Employment Report Expectations) Employment Change: +10.0K vs. -17.7K prior Unemployment Rate: 6.9% vs. 6.9% prior Participation Rate: 65.1% vs. 65.0% prior Average Hourly Wages (Permanent Employees YoY): 4.8% Full-Time Employment Change: Prior -46.7K Part-Time Employment Change: Prior +29.0K What Markets Will Be Watching Whether U.S. job growth slows further toward the 100K level. Whether U.S. wage growth remains firm despite softer hiring. With inflation higher, having wages fall behind takes more money from consumers but also raises the cost of production (all things equal) for corporation Whether Canada's labor market rebounds from April's decline. Any surprises that could alter expectations for Fed or Bank of Canada interest-rate policy. This article was written by Greg Michalowski at investinglive.com.

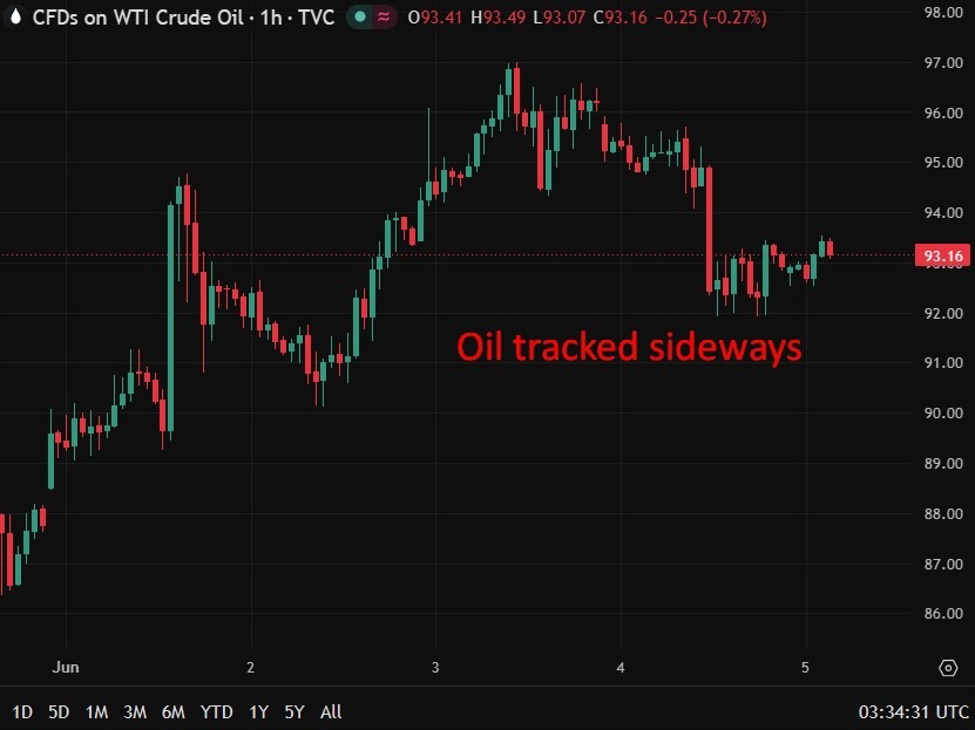
investingLive European markets wrap: A mixed mood waiting on NFP, US-Iran developments
Headlines: Markets: WTI crude lightly changed at $93.03 GBP leads, USD lags on the day European indices sit higher, DAX up 0.3% and CAC 40 up 0.6% US futures mixed with Nasdaq futures down 1.0%, Dow futures up 0.2% US 10-year yields flat at 4.475% Gold down 0.2% to $4,465 Bitcoin down 2.1% to $62,244 This article was written by Justin Low at investinglive.com.

America still refuses Iran's request to unfreeze the frozen funds - Al Arabiya
The core gap in the negotiations is the release of the frozen Iranian funds The method and mechanism for releasing the frozen Iranian funds is a gap in the negotiations Iran informed Pakistan of its acceptance to transfer part of its uranium to a third country it agrees upon America still refuses Iran's request to unfreeze the frozen funds This article was written by Giuseppe Dellamotta at investinglive.com.

What is the distribution of forecasts for the US NFP?
The ranges of estimates are important in terms of market reaction because when the actual data deviates from the expectations, it creates a surprise effect. Another important input in market's reaction is the distribution of forecasts. In fact, although we can have a range of estimates, most forecasts might be clustered on the upper bound of the range, so even if the data comes out inside the range of estimates but on the lower bound of the range, it can still create a surprise effect. Non-Farm Payrolls 70K to 110K range of estimates 50K-125K range most clustered 85K consensus Unemployment Rate 4.4% (17%) 4.3% (76%) - consensus 4.2% (7%) Average Hourly Earnings Y/Y 3.6% (3%) 3.5% (31%) 3.4% (60%) - consensus 3.3% (6%) Average Hourly Earnings M/M 0.4% (9%) 0.3% (75%) - consensus 0.2% (14%) 0.1% (2%) The NFP report, and especially the CPI, are likely to influence the tone at the upcoming FOMC meeting. The US jobs data has been consistently surprising to the upside pointing to a stable and even re-accelerating labour market. The Fed projected a 4.4% unemployment rate in 2026, so we are already below that. Their attention has shifted to inflation as that's the part of the mandate more in tension now. The Fed estimates that the NAIRU is around 4.2%, below that level the Fed could be already late with inflation having been above the 2% target for 5 years now. The expectations for rate hikes will highly likely grow stronger. This article was written by Giuseppe Dellamotta at investinglive.com.

What are the main events for today?
EUROPEAN SESSION In the European session, we don't have much on the agenda other than a couple of low tier releases like the final Eurozone Q1 GDP report and Italian Retail Sales. The data is not going to change anything for the ECB, so the market reaction will likely be muted. AMERICAN SESSION In the American session, we have the Canadian Employment report and the US NFP. The Canadian data is expected to show 10K jobs added in May vs -17.7K in April, and the Unemployment Rate to remain unchanged at 6.9%. Most of Canadian data has been surprising to the downside which led traders to pare back the hawkish bets. There's now just 46% chance of a rate hike by year-end. The US NFP is expected at 88K vs 115K in the prior month, and the Unemployment Rate to remain unchanged at 4.3%. The Average Hourly Earnings Y/Y is expected at 3.4% vs 3.6% prior, while the M/M metric is seen at 0.3% vs 0.2% prior. The NFP, and especially the CPI, are likely to influence the tone at the upcoming FOMC meeting. The US jobs data has been consistently surprising to the upside pointing to a stable and even re-accelerating labour market. The Fed projected a 4.4% unemployment rate in 2026, so we are already below that. Their attention has shifted to inflation as that's the part of the mandate more in tension now. CENTRAL BANK SPEAKERS 13:40 GMT/09:40 ET - BoE's Dhingra (dovish - voter) 18:00 GMT/14:00 ET - BoE Governor Bailey (neutral - voter) This article was written by Giuseppe Dellamotta at investinglive.com.

investingLive Asia-Pacific FX news wrap: Drone attack on Oman raises the stakes
6% at one stage. The Korean won deepened its slide against the dollar, hitting its weakest level since March 2009, as selling pressure intensified through the session. The proximate trigger was a suggestion from South Korea's Labour Minister that Samsung and other companies riding the AI boom should consider distributing a share of the excess profits those gains have produced. It was the kind of official commentary that has rattled Korean markets before, and traders did not wait to find out whether it would be followed by policy action. This article was written by Eamonn Sheridan at investinglive.com.
investingLive Americas market news wrap: Another comeback for stocks as Trump talks peace
Markets: S&P 500 up 0.4% WTI crude oil down $2.91 to $93.11 Gold up $46 to $4478 US 10-year yields down 1.4 bps to 4.48% Bitcoin down $1500 to $63,400 CHF leads, USD lags Late in the day, we're getting more comments from Trump on the situation in Lebanon, as he says "I think progress has been made" and that "I think things will happen over there." The day started with positive comments from him on the deal and that started a big turnaround, that was also helped by a drop in oil prices. Overall, it was another record close for the S&P 500 but the Nasdaq dipped slightly on a big drop in Broadcom shares. However that the index only declined slightly despite a crushing drop in one of the world's largest companies and a big AI beneficiary is inspiring for the bulls. In FX, the dollar was relatively quiet but weaker in line with the more-peaceful talk from Trump. Bonds also pointed in that direction. Overall, economic news was light today and the path of least-resistance was higher in risk assets. The strength in the stock markets was impressive as it's been for the past two months. This article was written by Adam Button at investinglive.com.

The USD has reversed most of the earlier declines vs the EUR, JPY and GBP. What next?
The U.S. dollar began the North American session on the defensive, but in today's tightly confined trading environment, momentum and bias can shift quickly. Over the past several days, both the EURUSD and GBPUSD have been oscillating around their converged 100- and 200-hour moving averages, using those levels as key barometers for short-term direction. Meanwhile, the USDJPY has maintained a more bullish tone, holding above its hourly moving averages and grinding higher toward the important 160.00 level. As the North American session progressed, however, the dollar reversed course. The move lower in the EURUSD and GBPUSD faded, allowing both pairs to rotate back below their 100- and 200-hour moving averages, shifting the near-term technical bias back toward the sellers. At the same time, the USDJPY resumed its climb and is once again testing the closely watched 160.00 level, an area traders continue to view as both a technical and psychological hurdle. In the video above, I take an updated look at the three major currency pairs as trading winds down for the day. Which technical levels are now in play? Where are the key risk-defining areas for buyers and sellers? And what should traders be watching as the market heads into the next trading session? This article was written by Greg Michalowski at investinglive.com.

Ukraine Zelensky to Putin: Enough of war. Ukraine proposes to and this war
In a letter to Russia's Putin, Ukraine's Zelenskiy proposed to end the war saying "Enough of war". In a striking public letter addressed directly to Vladimir Putin, President Zelensky called for an immediate end to the war and proposed a face-to-face meeting at a neutral venue — naming Switzerland, Türkiye, and Arab states as potential hosts. He made clear that after 26 years, there is nothing for a Ukrainian leader to do in Moscow, just as there is nothing for a Russian leader to do in Kyiv. Zelensky pushed back on the idea that Ukraine's fate could be decided without Ukraine. Referencing the Alaska talks between U.S. and Russian officials, he was blunt: Ukrainian and European issues are not resolved in Anchorage. He called for Europe and the United States to be formal participants in any peace framework, arguing that a durable new security architecture for the region requires genuine guarantors — not just bilateral agreements prone to collapse, as the Minsk agreements proved. On the ground, he proposed that the current front line serve as the starting point for diplomacy — not a concession, but a practical baseline. Ukraine offered a full ceasefire for the duration of negotiations and an all-for-all prisoner exchange as an immediate confidence-building measure, noting the U.S. has the capability to monitor any halt in hostilities. The tone of the letter was firm but not without warning. Zelensky reminded Putin that Ukraine will continue fighting if he does not personally choose to end the war — but also noted that Russia itself faces exhaustion, invoking a pattern from Russian history: when Russia grows tired, change comes. "You can stop your war," he wrote. The letter closed with a tribute — "Eternal memory to all those whose lives were taken by this war" — and the Ukrainian salute: Glory to Ukraine. "If you do not personally come to the conclusion that it is time to end this war, Ukraine will continue fighting for its existence. We will have those who support us. But you, too, will have to fight much harder for your own existence." — President Volodymyr Zelensky, open letter to Vladimir Putin Russia's Putin has added to his earlier comments: No need to stop fighting to start talks with Ukraine. No proof of cyber attacks from Russia on Europe, acts of sabotage. Europe should treat Russia as an equal partner On Iran, Putin says: We hope that US and Iran five, rising in the conflict Advantages for Russia from Iranian crisis are temporary. Russia wants Iranian conflict and the soonest possible Ukraine Foreign Minister adds they they will pass Zelenskiy's letter to Putin officially through diplomatic channels. Do they have peace in their hearts? This article was written by Greg Michalowski at investinglive.com.

Putin: We are ready to make a deal with Ukraine peacefully
This is a new tone from Putin, it sounds like he wants the war to end: In Alaska, Trump asked Russia for some compromises, Russia is ready Ukraine also needs to compromise and the conflict will end quickly then Russia has all the resources to fulfill the military goals, and they are getting stronger Unfortunately, some Ukrainian drones are getting through to Russia We need to strengthen our air defense system Ukraine's army problem is a catastrophic lack of personnel More than 85% of Donetsk Region is under Russia's control Russia controls 80% of Zaporizhzia Region Ukraine is losing territory These are some notable comments and are negative for energy prices, particularly in Europe. This article was written by Adam Button at investinglive.com.

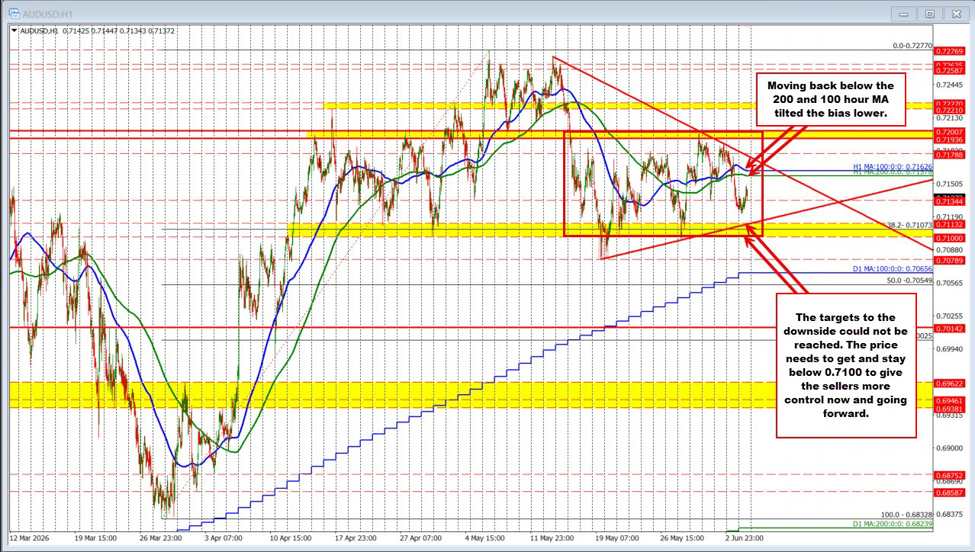
AUDUSD has a bearish tilt but the price remains contained within 100 ip and down range
As a result, the technical bias remains tilted to the downside while the price stays below the hourly moving averages. However, sellers still have work to do. To strengthen the bearish case and gain greater control, they need to break below and stay below the 0.7100–0.7113 support area. Until that happens, the broader trading range remains intact and the risk of another bounce from support cannot be ruled out. This article was written by Greg Michalowski at investinglive.com.
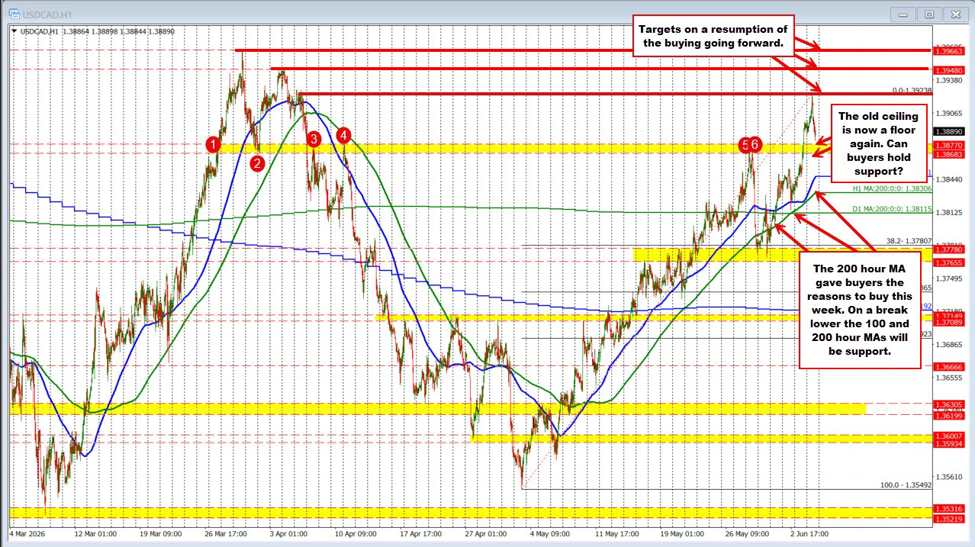
USDCAD technical analysis:USDCAD corrects toward a support target as the upside run stalls
If sellers regain control and break below the swing area, the focus would turn to the rising 100-hour moving average at 1.3845, the 200-hour moving average at 1.3830, and ultimately the 100-day moving average near 1.3811. This article was written by Greg Michalowski at investinglive.com.
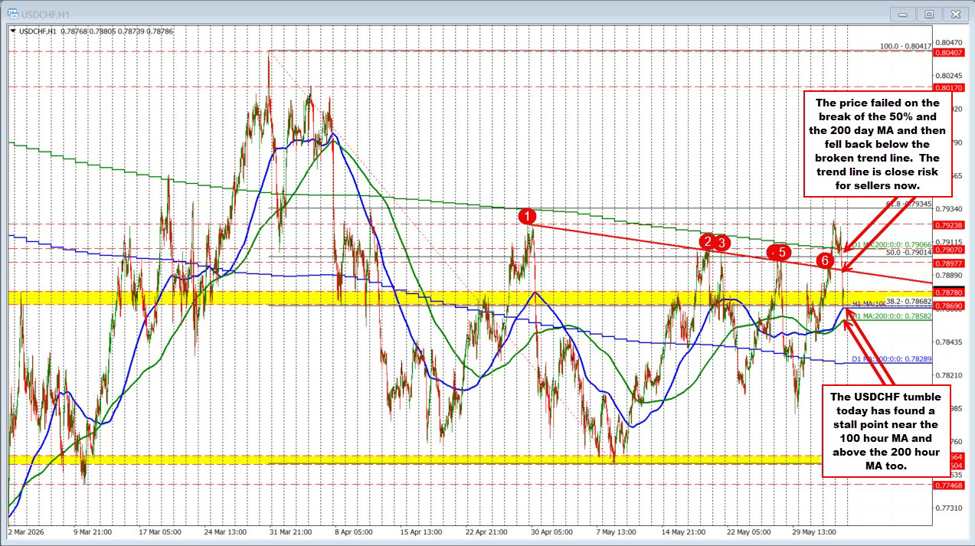
USDCHF tumbles after run to the upside yesterday fails on the break of the 200 day MA
The USDCHF surged higher in trading yesterday, breaking above a key downward-sloping trendline near 0.7893 and then pushing through its 200-day moving average at 0.79066. That move marked the pair's first break above the 200-day moving average since April 8 and gave buyers the green light to extend the rally. Momentum carried the pair above the April 29 high at 0.79238, but the breakout lacked follow-through, and sellers quickly regained control. In trading today, sellers initially attempted to push the pair back below the 200-day moving average, but buyers stepped in near the 50% midpoint of the move up from the early-April low at 0.79014, helping spark another rally. However, that rebound also ran out of steam. Over the last several hours, selling pressure has intensified, driving the price back below the 200-day moving average (0.79066), the 50% midpoint (0.79014), and the previously broken trendline near 0.7892. The renewed downside momentum has taken the pair toward a critical support zone defined by the rising 100-hour moving average at 0.7866 and the 200-hour moving average at 0.7858. The session low has reached 0.7869 so far, with buyers attempting to defend the area. For sellers to gain firmer control, they will need to break and stay below both moving averages. It's worth noting that on Tuesday, the price briefly moved below these levels but quickly rebounded, reestablishing support and setting the stage for yesterday's rally. Buyers had their opportunity above the 200-day moving average and failed to maintain momentum. Now it's the sellers' turn. The key question is whether they can extend the move below the 100- and 200-hour moving averages, or whether dip buyers will once again defend support and drive the pair back toward the former trendline resistance near 0.7892. Fundamentally, the move lower in USDCHF has been driven by a combination of safe-haven demand for the Swiss franc and broad-based U.S. dollar weakness. Interestingly, Switzerland's CPI report came in weaker than expected today, but rather than weighing on the franc, the currency remained firm. One explanation is that softer inflation reduces the urgency for the Swiss National Bank to pursue additional aggressive rate cuts. With the market already anticipating a dovish SNB, the weaker inflation data did little to undermine the franc and may have even reinforced its relative appeal as a safe-haven currency amid ongoing uncertainty. This article was written by Greg Michalowski at investinglive.com.
US Initial jobless claims 225K vs 213K estimate. Continuing Claims 1.777M vs 1.780M est.
Prior week for initial jobless claims 209K revised to 212K. Prior week for continuing claims 1.786 million revised to 1.785M initial jobless claims come in higher at 225K vs 213K estimate and a revised 212K last week. Largest since the first week of February 4-week moving average comes in at 214.75K up from 208.25K last week Continuing claims 1.777M versus 1.780 million estimate. The 4-week moving average was 1,777,250, an increase of 4,750 from the previous week's revised average. The previous week's average was revised down by 250 from 1,772,750 to 1,772,500. The initial jobless claims move higher in the current week suggestive of a weakening jobs picture. It is the highest level since the first week of February, but still relatively low and steady. The continuing claims moved marginally lower. Note that the continuing claims are on week delay. So next week's data will match up with this week's data for the initial jobless claims. The US stock market remains mixed in premarket trading with the NASDAQ down -358 points, but the Dow industrial average of 506 points. The S&P is down -19.43 points in premarket trading. US yields are lower with the two-year at 4.039% -4.5 basis points. The 10 year yield is down -3.8 basis points at 4.455%. The 30 year is at 4.960% -3.0 basis points. What is the weekly employment claims data? For background, the weekly US jobless claims reports are released by the United States Department of Labor every Thursday morning and are one of the fastest indicators of labor market conditions in the United States. The report includes two key measures: Initial Claims and Continuing Claims. Initial Claims track the number of people filing for unemployment benefits for the first time during the previous week. In simple terms, it measures how many workers were newly laid off and applied for assistance. When initial claims stay low, it usually signals that employers are keeping workers and the job market remains healthy. Rising claims can be an early warning sign that layoffs are increasing and economic growth may be slowing. Continuing Claims measure the number of people who remain on unemployment benefits after their initial filing. This helps show whether unemployed workers are finding new jobs quickly or struggling to get rehired. If continuing claims rise, it often suggests hiring conditions are becoming more difficult and people are remaining unemployed longer. If they decline, it typically points to improving job opportunities and stronger labor demand. Together, the two reports provide investors, economists, businesses, and the Federal Reserve with an important real-time look at the strength of the US labor market and broader economy. This article was written by Greg Michalowski at investinglive.com.
Daily forex & trading digest.
The most useful 5 stories in this beat, every weekday at 7am local.